Recreating Search Console Insights in Looker
The new Search Console Insights (Beta) from Google ⤴ , gives you some nice tables to look at.
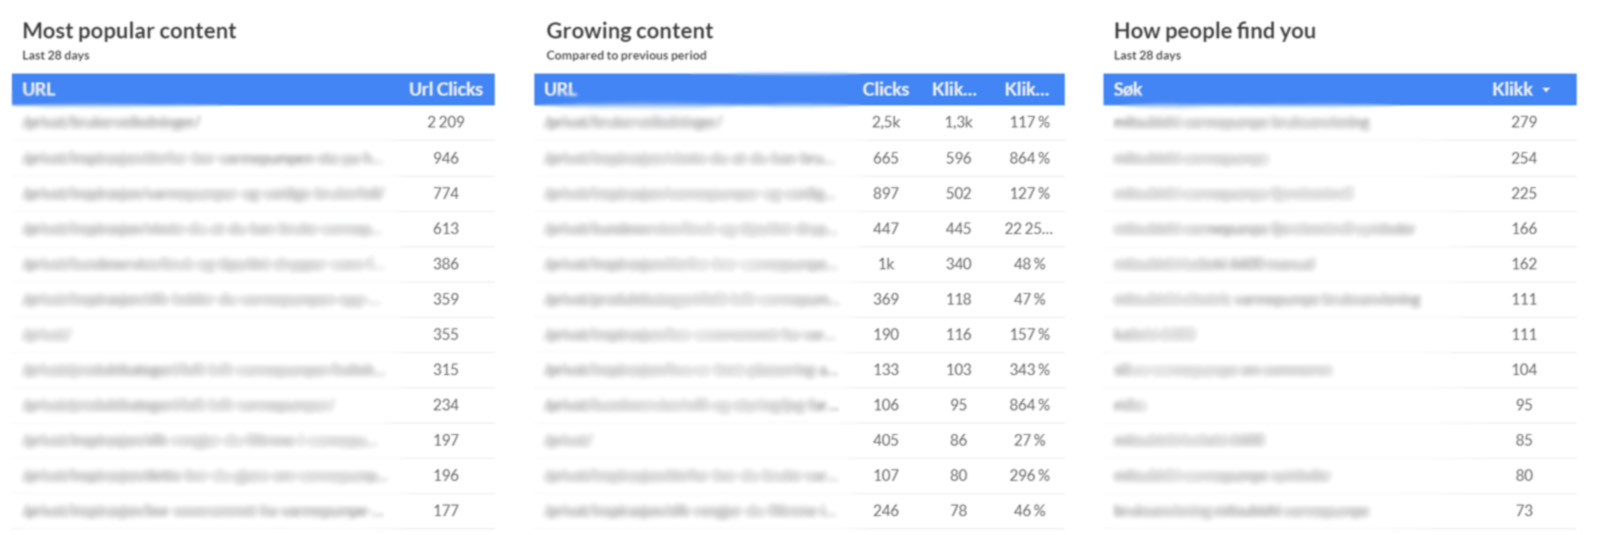
- Your most popular content
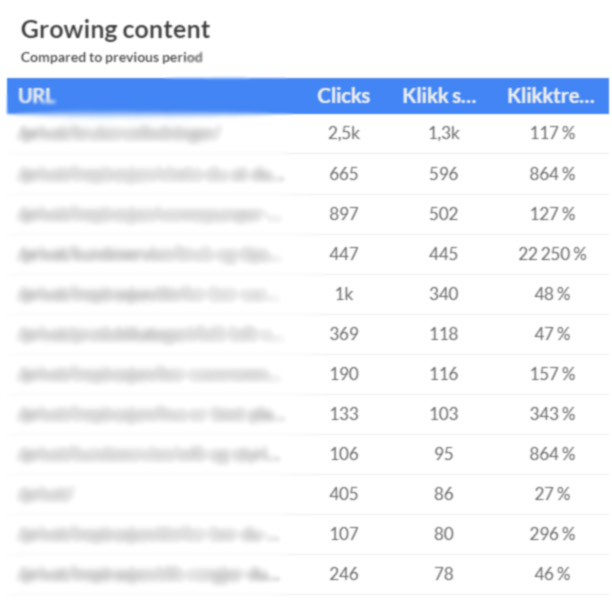
- Your growing content
- How people find you
The insights can be found at the top of your GSC reports.
I wanted to recreate them but couldn't find a guide on how to get the same tables in Looker, but after some workaround I think i got something useful:
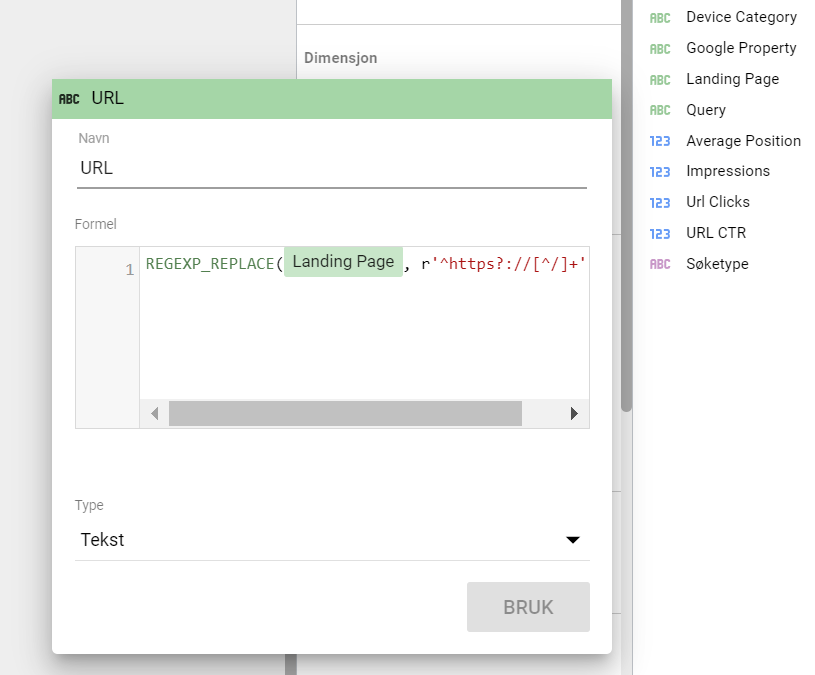
1. Shortening URLs
To reduce how long the URLs were going to be I wanted to start off by removing the domain from each URL string, only leaving the path URL.
You can remove the domain from the URL by adding this formula:
- regexp_replace(Landing Page, r'^https?://[^/]+', '')
Or this one if you're using GSC through Supermetrics:
- regexp_replace(Full URL, r'^https?://[^/]+', '')
2. Supermetrics data source
When using GSC' own data source in Looker, I got some data that didn't match my reports in GSC.
Adding search console through supermetrics gave me the correct data with the same amount of clicks and impressions that I saw in my GSC reports.
3. Recreating the tables
When recreating the tables I placed them next to eachother and added some simple styling.
Your most Popular Content
Adding the "Your Most Popular Content" table was quite straightforward. I added a table with a GSC/Supermetrics data source, Landing page and then sorted by Clicks.
Your growing content
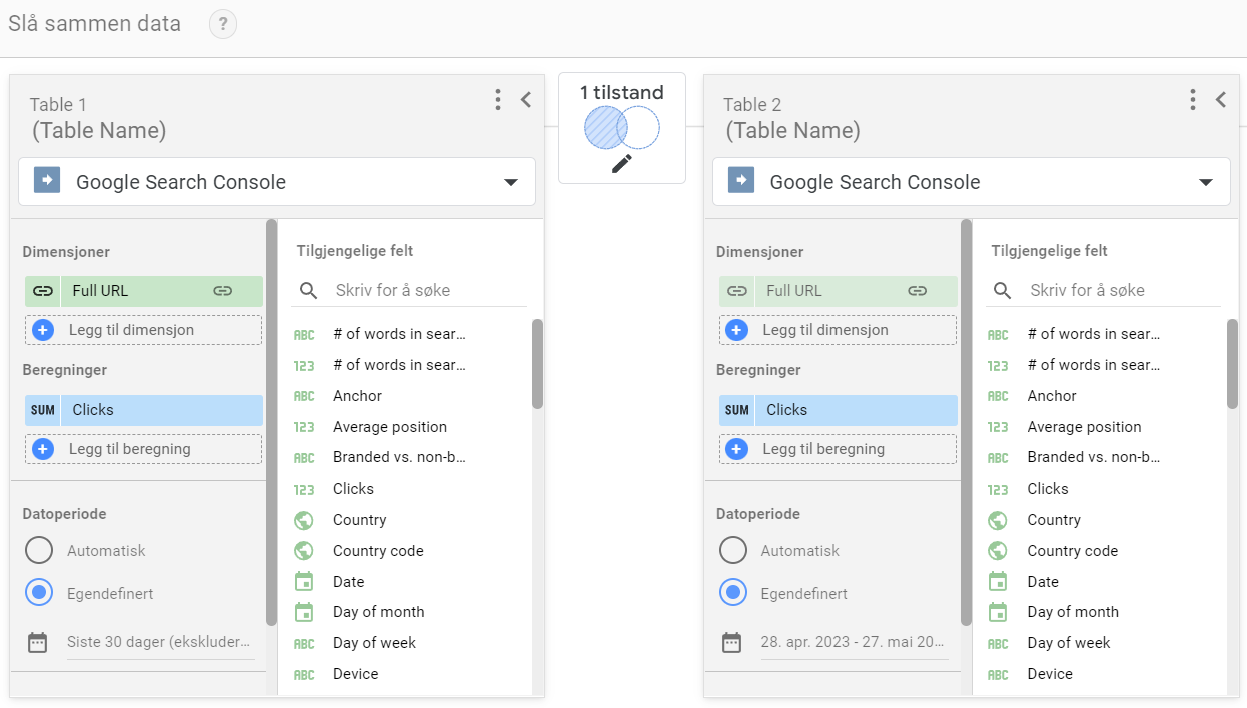
Emulating the "Your Growing Content" table was slightly more challenging. I started by adding a table with page and clicks.
I then merged two different search consoles data sources, with different time periods. 1 for last the 30 days, a second one for the 30 days before that, then blending them with ‘inside to the left’.
Next, I wanted to add two more columns in my table.
- Clicks compared to last period
- Click trend
To get the 'clicks compared to last period', I added a new calculation with this formula.
- sum(Clicks (Bord 1))-sum(Clicks (Bord 2))
And to get the last column in the table; 'Click trend', I added this other calculation with this formula:
- (sum(Clicks (Bord 1))-sum(Clicks (Bord 2)))/(sum(Clicks (Bord 2)))
Lastly, I sorted the table by 'clicks compared to last period', to get a true representation of what content is really growing and not just a list of newly published content.
I now had a table that would show me:
- How many clicks this content had in the last period
- How many more clicks it had this period compared to the previous period
- And how much it has increased in a percentage since previous period
How People Find You
Recreating the "How People Find You" feature involves sorting queries by clicks, which was also quite straightforward. Here it can be a good idea to filter out any brand-related terms through the filter function.
Disclaimer
Keep in mind that the clicks compared to the previous period in the table where I blended two data sources, won't be updated automatically because the time period is custom. This means it needs to be manually updated once in a while to reflect the most accurate data.